
Ask your records a question. Get the report.
Type a question the way you would ask a colleague, and FireInspection360 builds the report that answers it from your own inspections, violations, permits, plan reviews, invoices and properties: the filters, the grouping, the totals and the chart. Every part is on screen, so you see exactly what was counted before you rely on the number.

In most systems, a new question waits on someone else.
The reports in the menu answer the questions the vendor thought of. Every other question becomes a support ticket, or an export that someone rebuilds in a spreadsheet every month.
A new report is a support ticket
When the board asks a question the report menu does not cover, the department waits for the vendor to write the report, or for the one person who knows the query language.
Anyone on staff types the question and gets the report, or builds it by hand: a record type, the columns, the filters, a grouping and its totals, with the answer on screen as they work.
An answer nobody can check
A figure in a chat window or an exported sheet arrives with no way to see what was counted, so self-reports slip into the inspection count, voided fees into revenue, and the number in the meeting never matches the screen.
A question comes back as a report, never a sentence with a number in it. Its rows are built by the same rules as your analytics pages, and every filter is a chip you can read and change.
A useful report lives on one desk
The report someone finally built is a file on their computer, rebuilt and emailed by hand each month, and it leaves when they do.
A report is saved in the system, private or shared with the department, and can be emailed every week or month with a summary and the file attached.
Shown with sample data. Click the image to see the whole page.
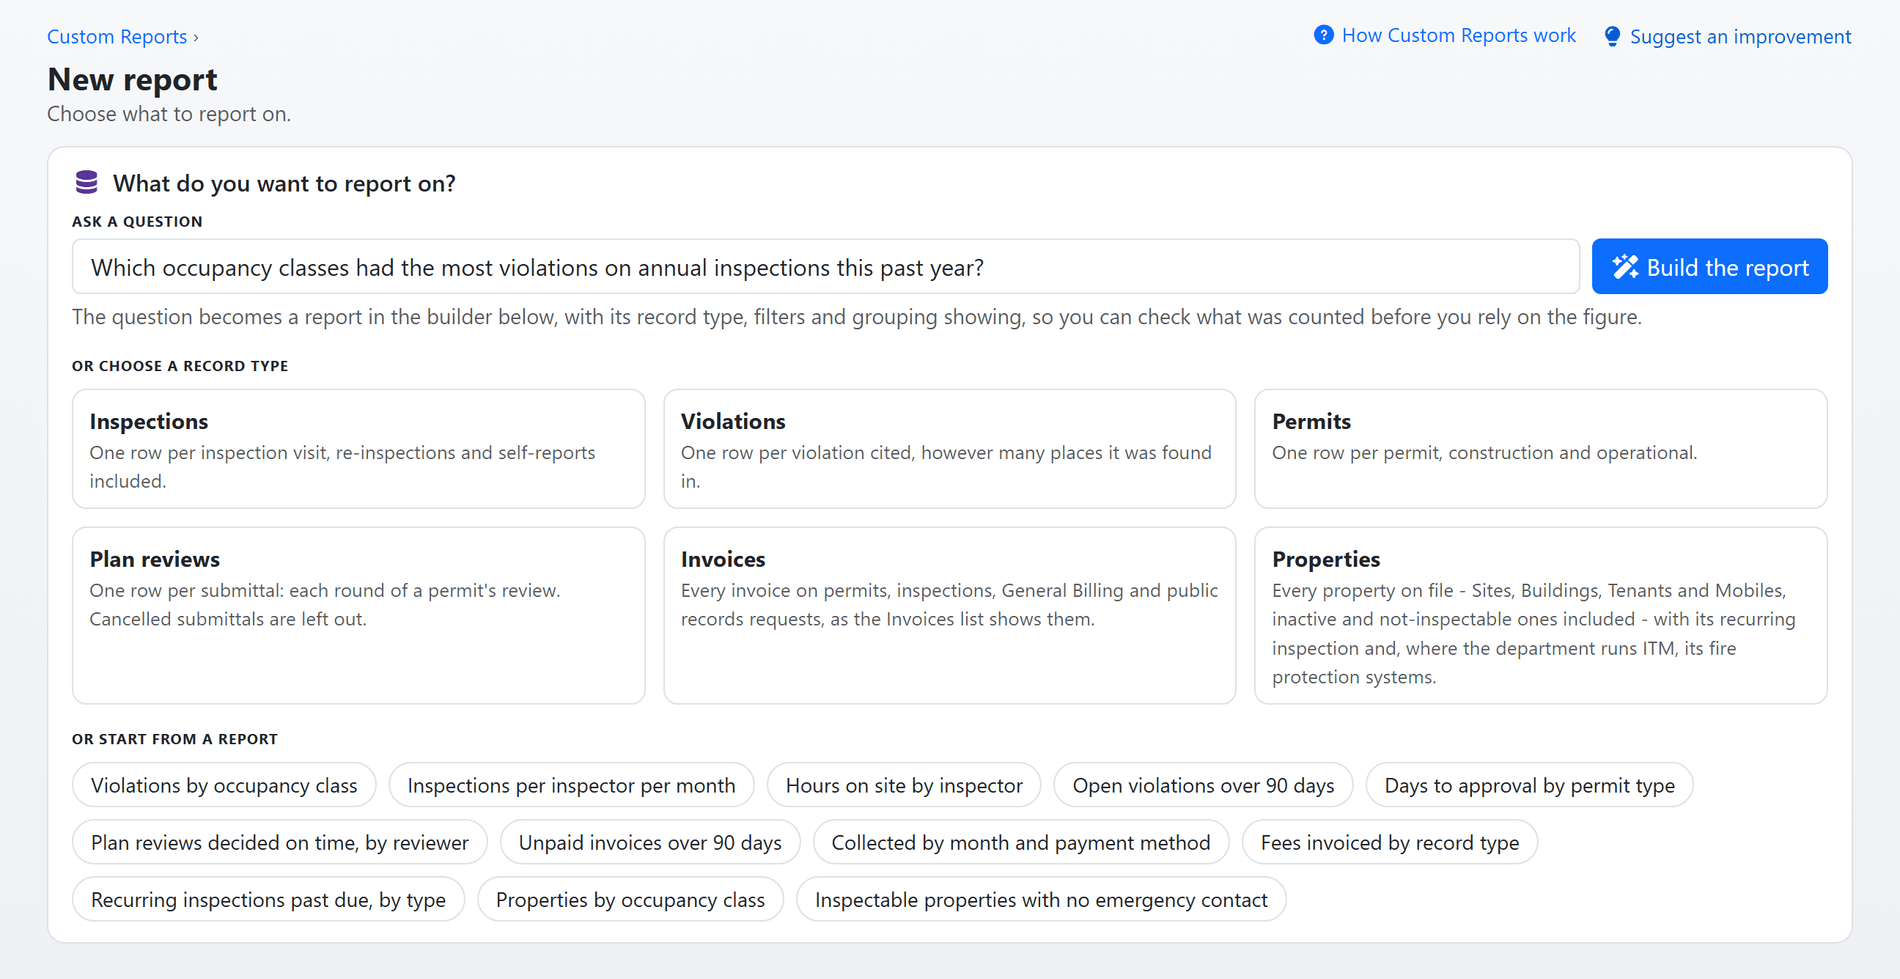
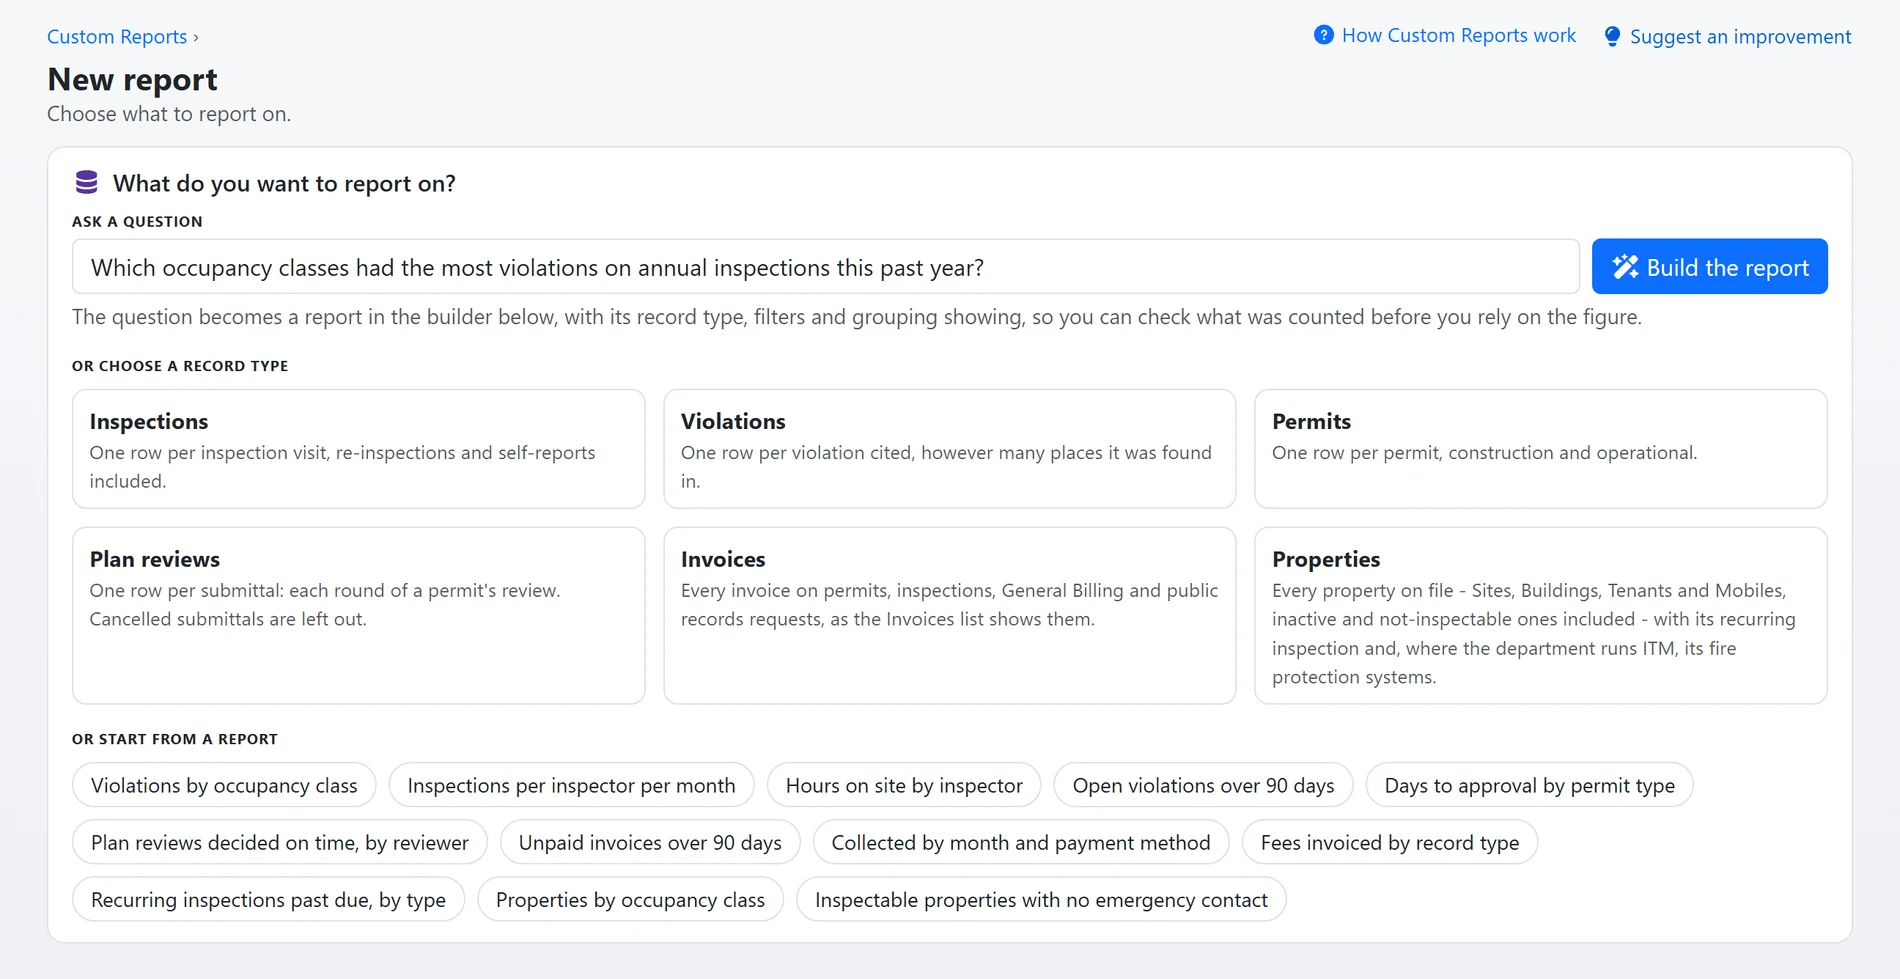
Type the question. FireInspection360 builds the report.
Which occupancy classes had the most violations this year? How long did fire alarm permits take to approve, month by month? Who has open violations more than 90 days old? Ask it in plain words and the report opens in the builder, already filtered, grouped, totalled and charted.
- In your department's words: the question is read against your own inspection types, permit types, statuses, towns and staff, so "annual inspections" and "fire alarm permits" mean what they mean at your department.
- The answer is the report: never a sentence with a figure in it. The record type, every filter and every grouping are on the page, so you see what was counted and change any part of it.
- It says how it read you: one plain sentence states how the question was understood, and anything that could not be used, a column your department does not have or a value nobody uses, is named rather than guessed.
- Then it is an ordinary report: change it, chart it, save it, share it with the department or have it emailed every week.
- Your records stay yours: the AI sees the record types, their columns and the values your records use, never the records themselves, and it never changes anything.
Shown with sample data.
Shown with sample data. Click the image to see the whole page.
Filter, group, total and chart, with no query language.
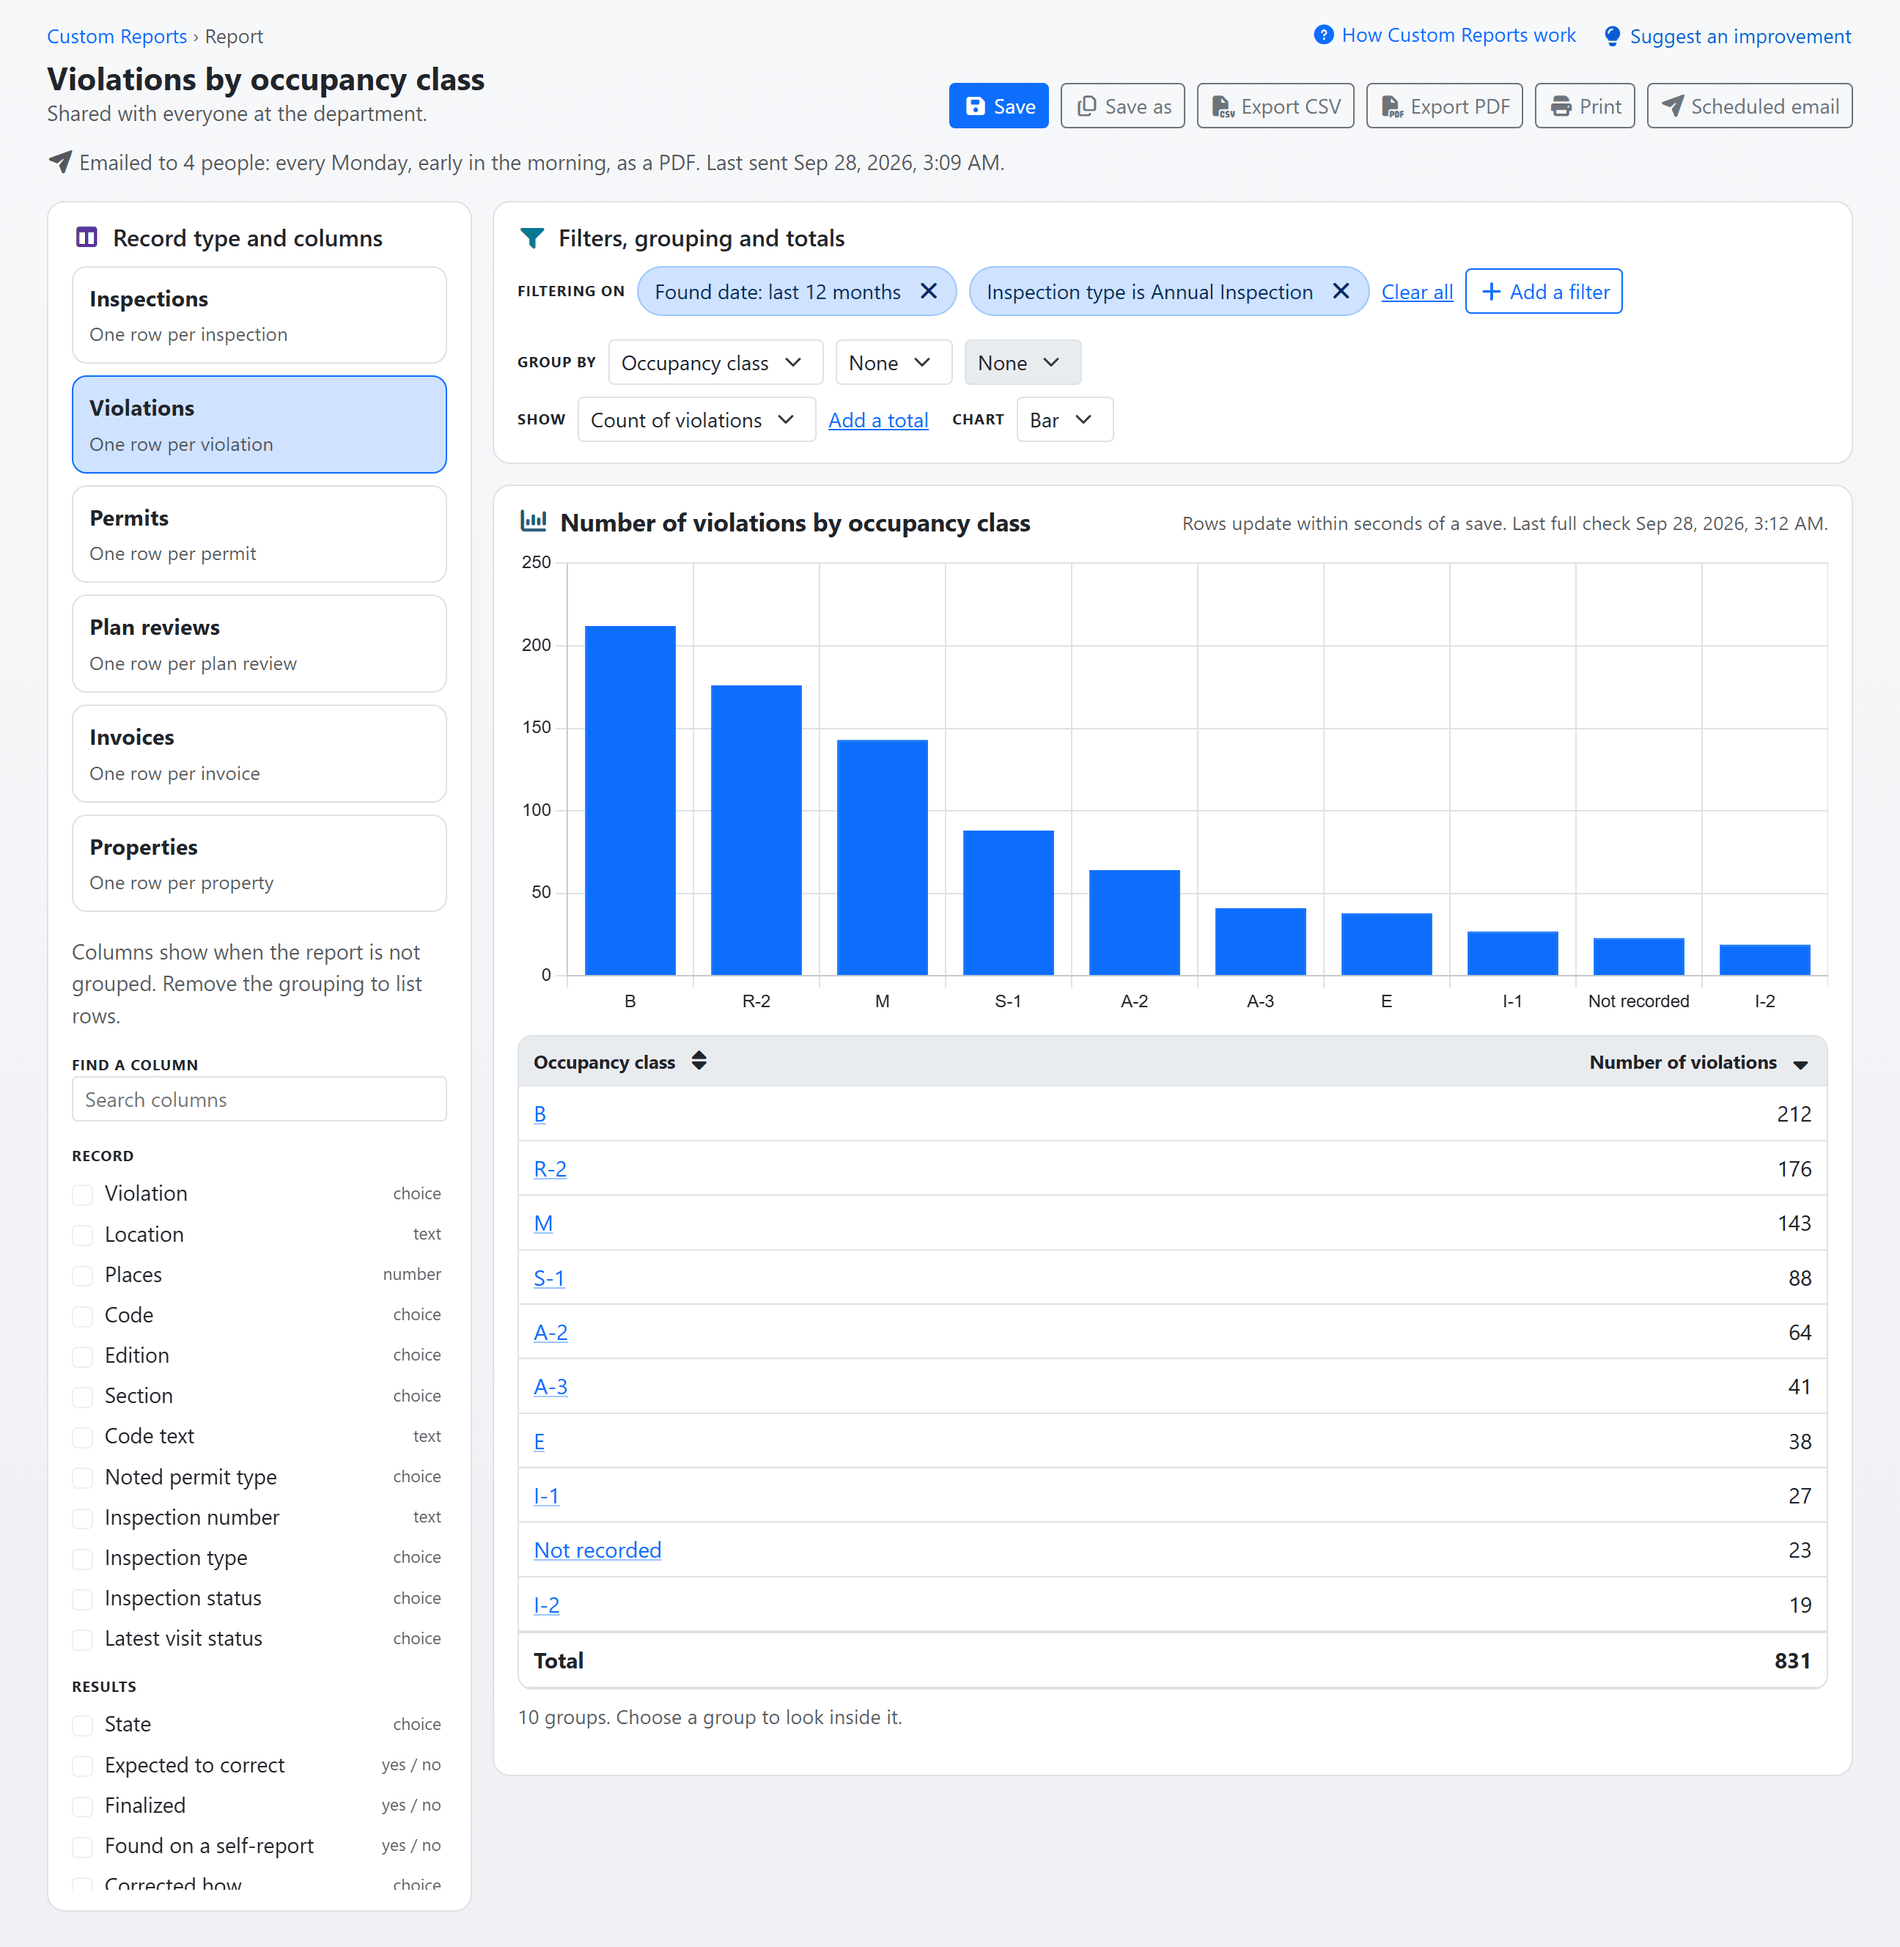
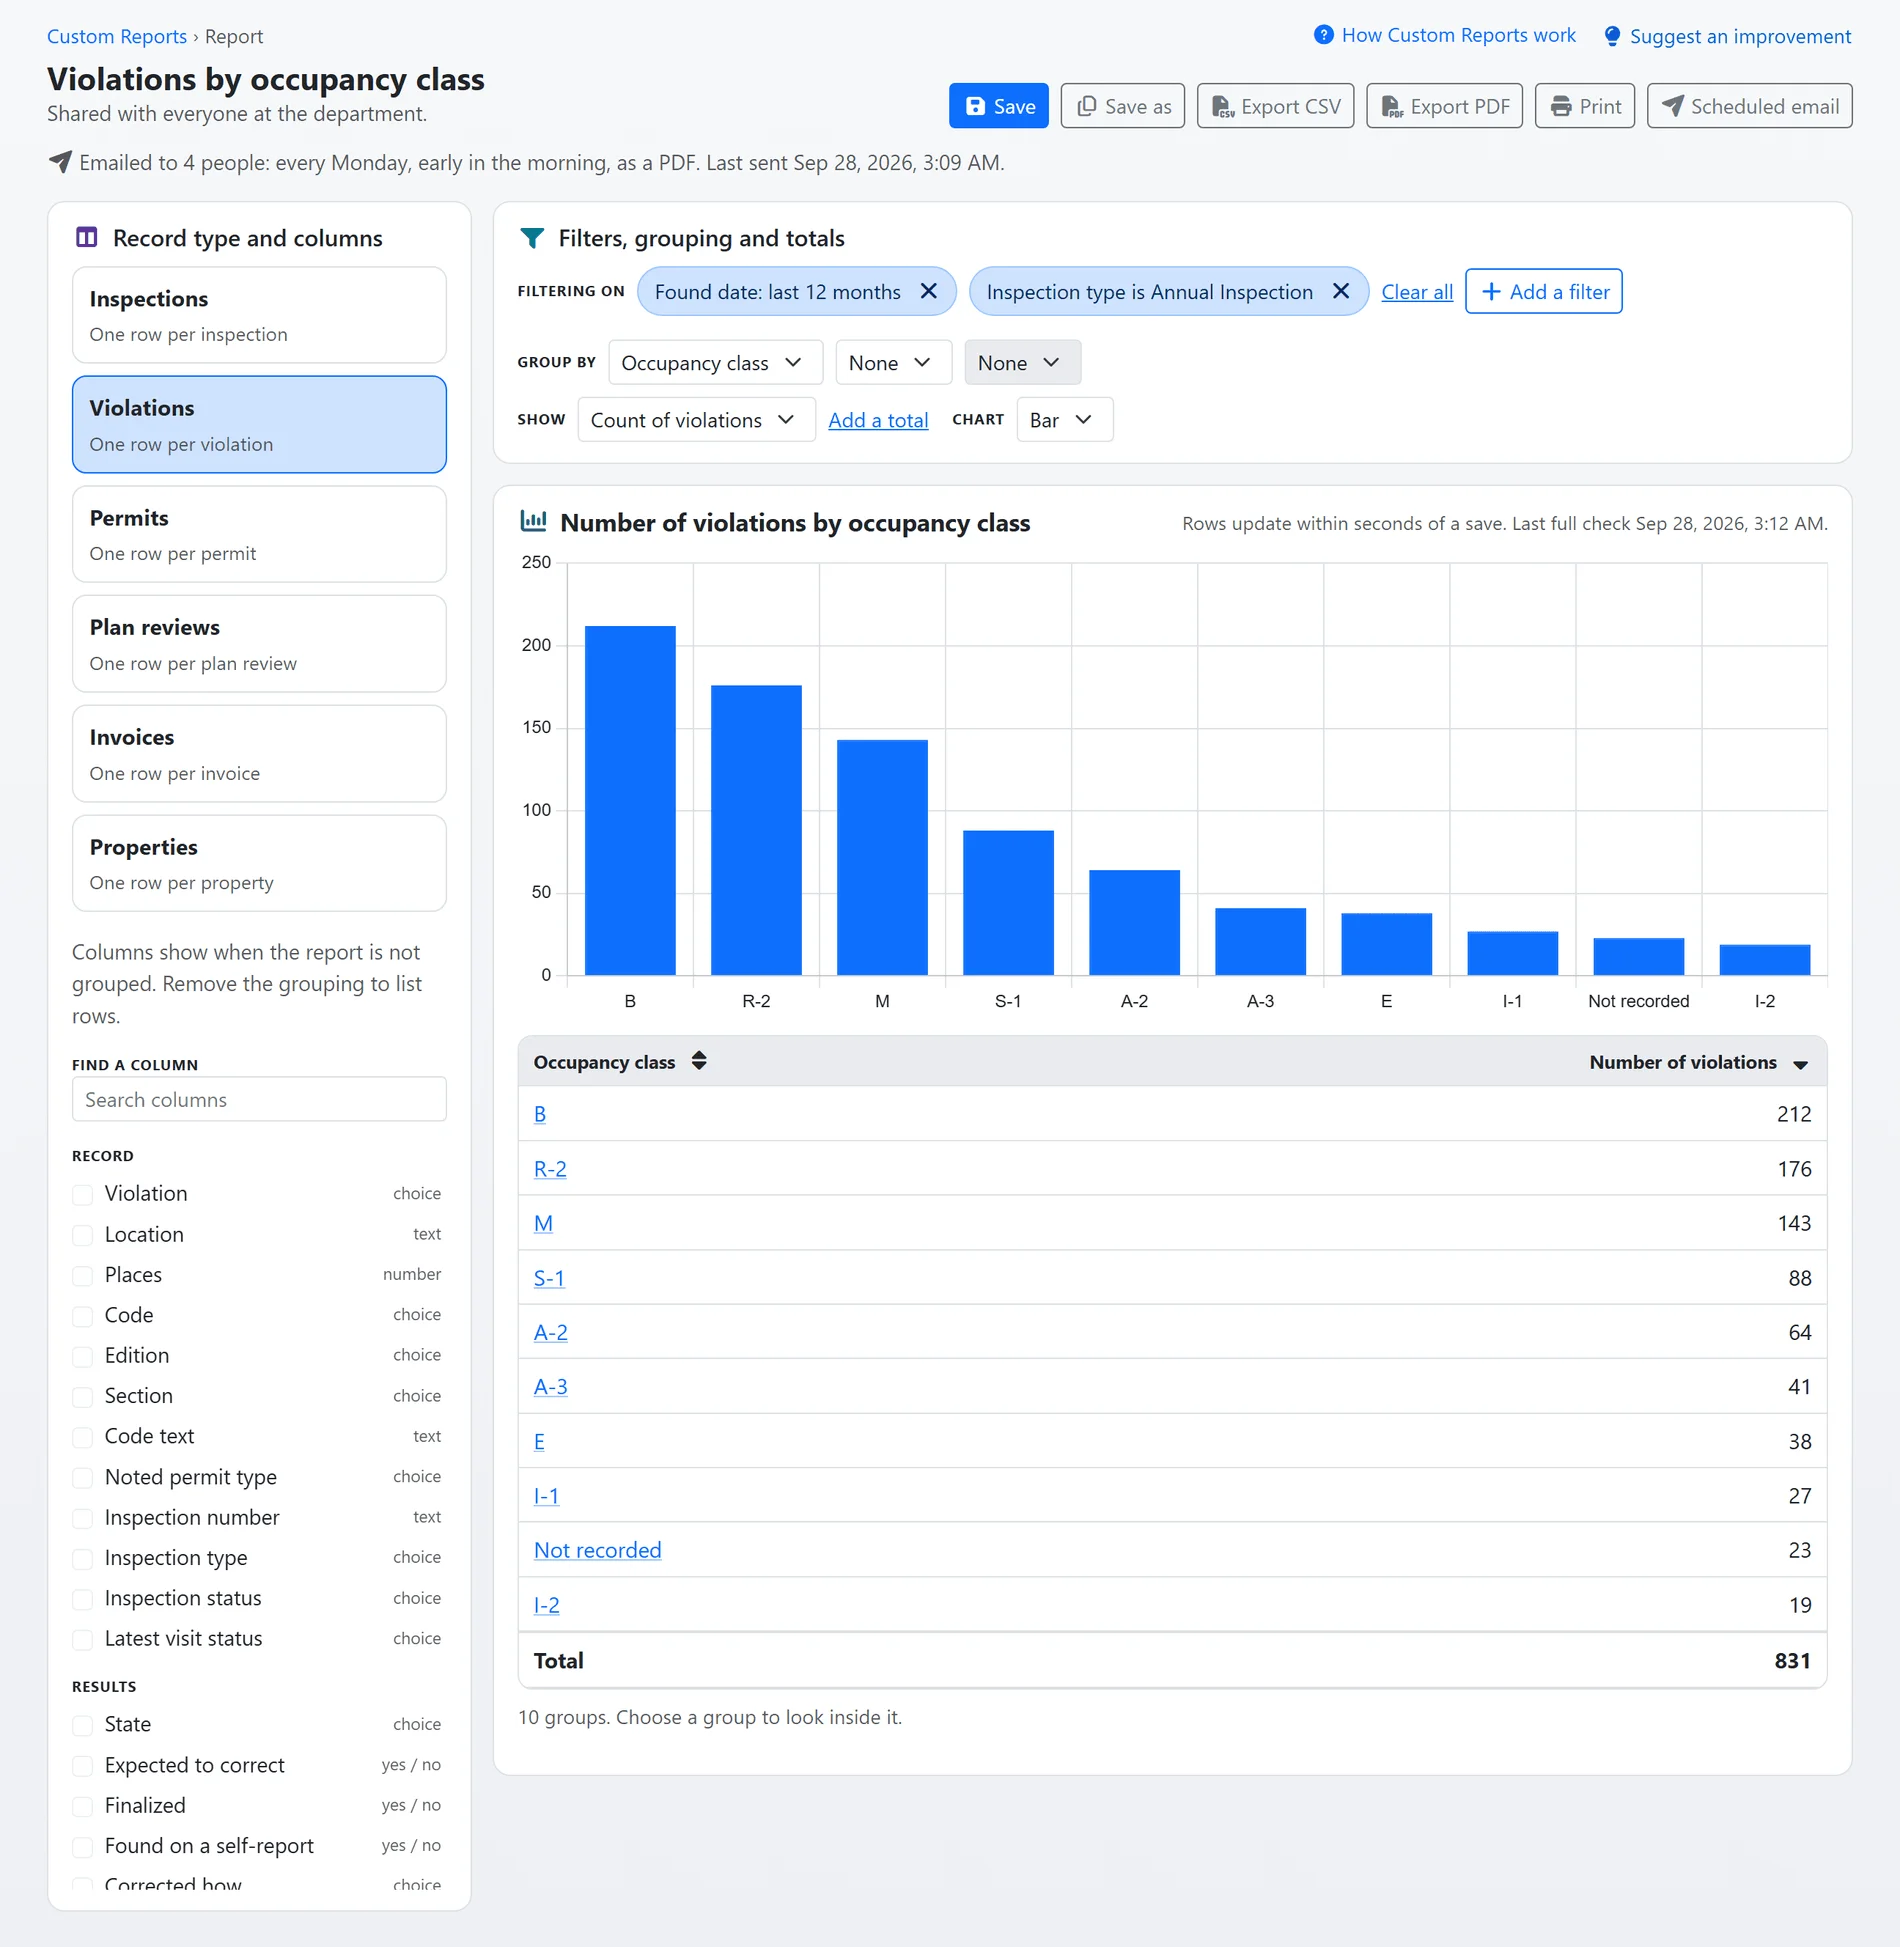
Every report a question builds can be changed by hand, and any report can be built by hand from the start. Choose what to report on and the page answers as you work. Add a filter and the table changes, pick a grouping and the totals appear, choose a chart and it draws. Nothing is written in a query language and nothing waits on FI360.
- Six record types: inspections with one row per visit, violations with one row per violation cited, permits, plan reviews with one row per review round, invoices and properties, each column labelled in plain words.
- Filters as chips: pick from the values a column holds, find words in text, set a number range, yes or no, or blank. A date filter is a period such as last month or this fiscal year, counted on your department's calendar.
- Groups and totals: group by up to three columns, a date by day, month, quarter, year or fiscal year, and show a count, a sum, an average, the lowest or the highest for each group, with a total row beneath.
- A chart in one click: a bar, line or pie chart of any report grouped one way.
- Look inside a group: choose a group, or its bar in the chart, and the report filters on it and lists the rows behind the number.
Shown with sample data.
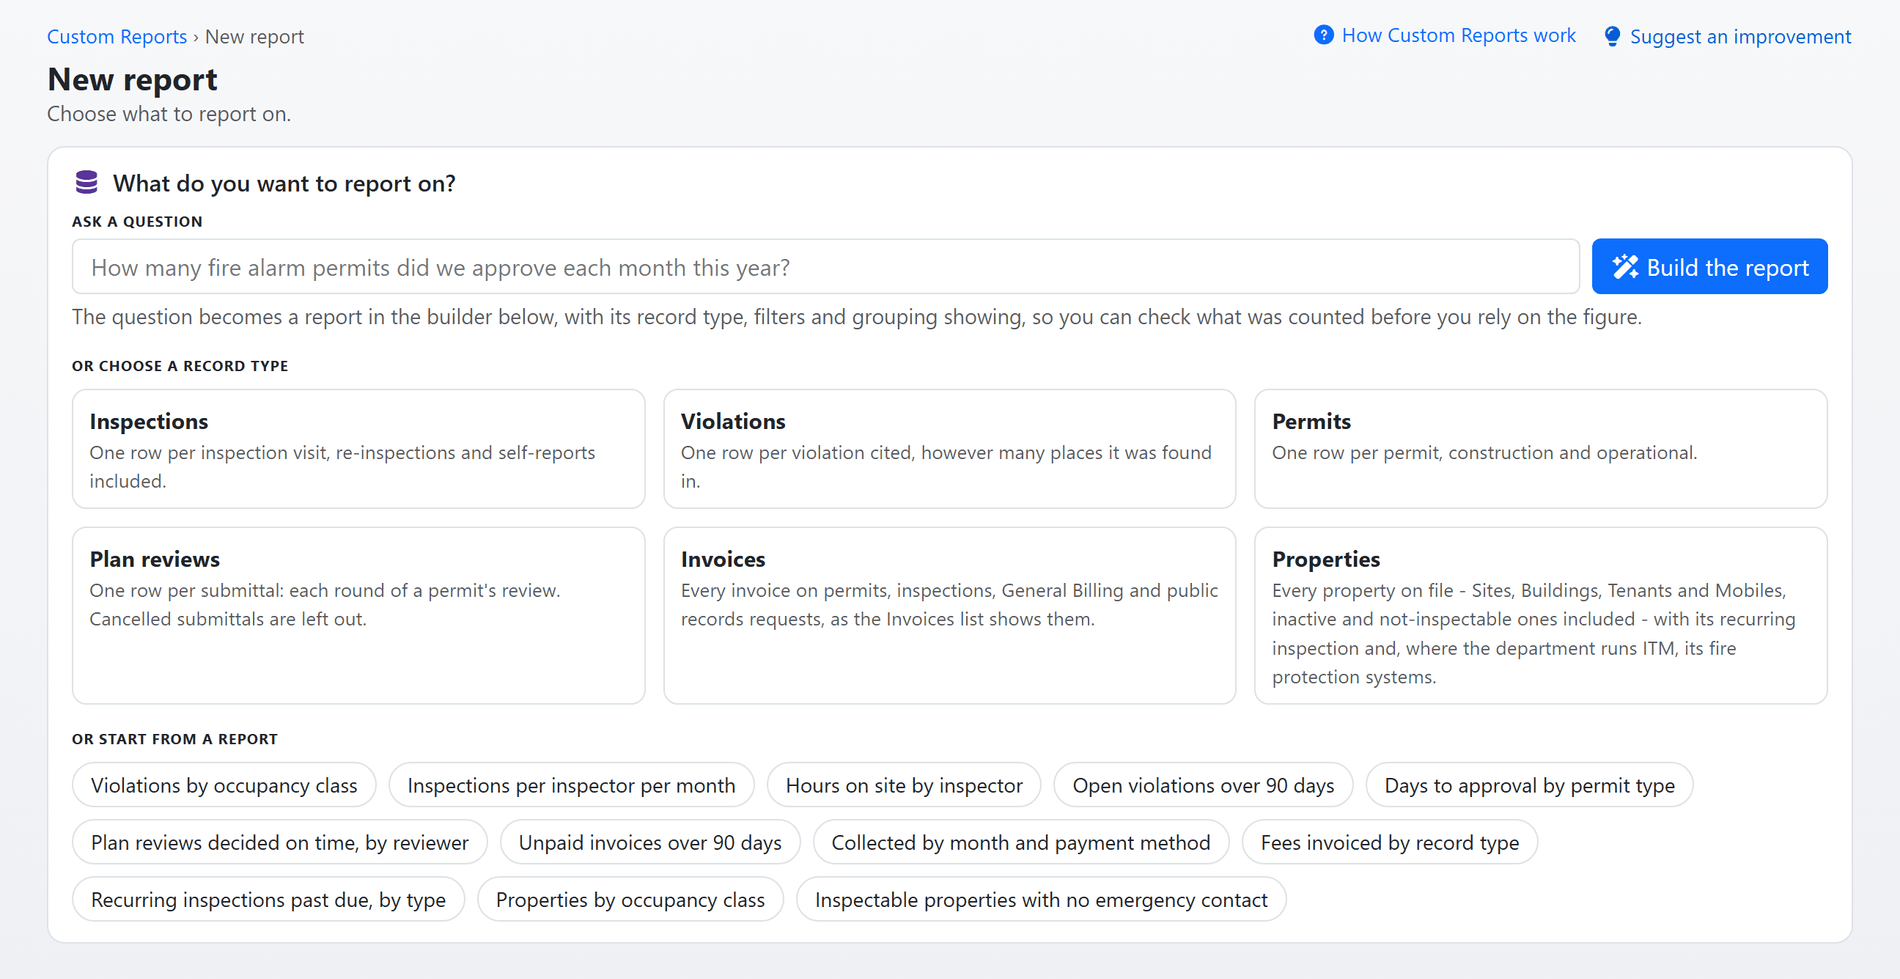
Shown with sample data. Click the image to see the whole page.
Start from a report FI360 already wrote.
Not sure where to begin? Open one of FI360's starter reports and it runs straight away. Change anything you like: it becomes a report of your own, and FI360's original stays as it was.
- The questions departments ask: violations by occupancy class, inspections per inspector per month, days to approval by permit type, plan reviews decided on time, unpaid invoices over 90 days and recurring inspections past due, among others.
- Counted like the pages: a starter that counts inspections leaves self-reports out, as the Inspections analytics page does, and a starter about money counts what the Financial pages count. The filter that does it is a chip you can see.
- Kept by FI360: the starter reports are written and kept up to date by FI360, and the page offers each one once its record type is ready at your department.
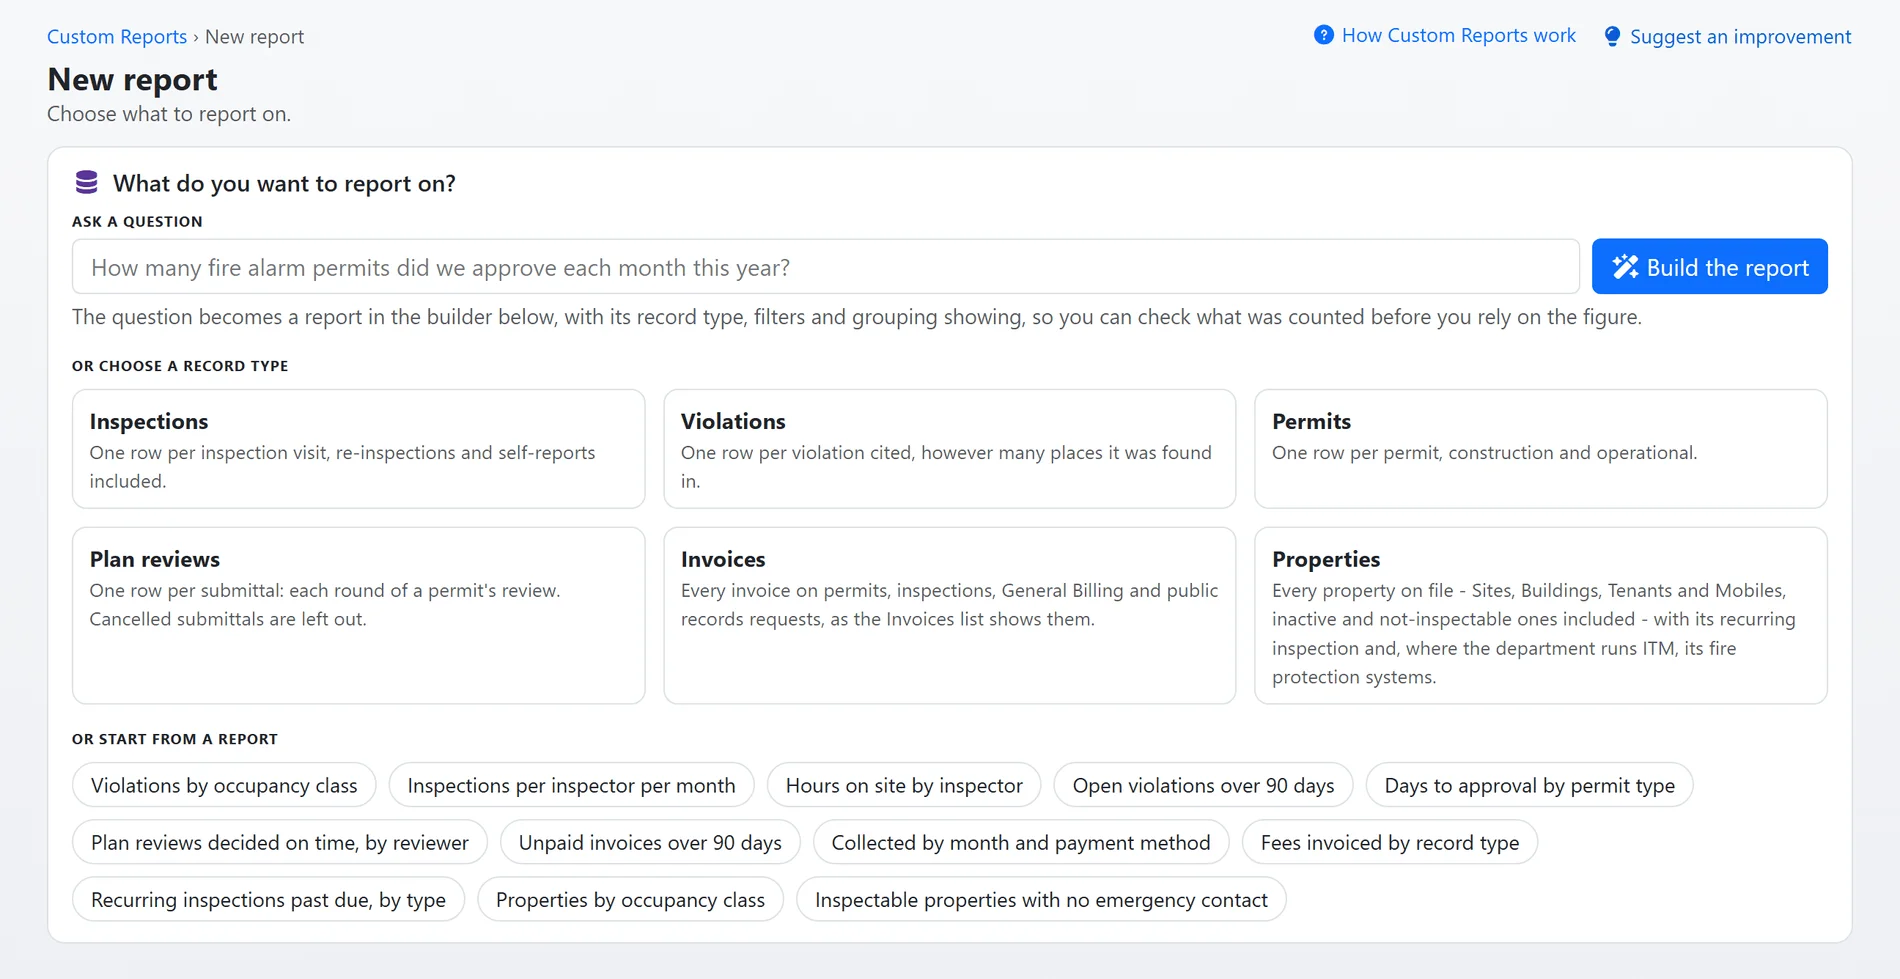
Shown with sample data.
Shown with sample data. Click the image to see the whole page.
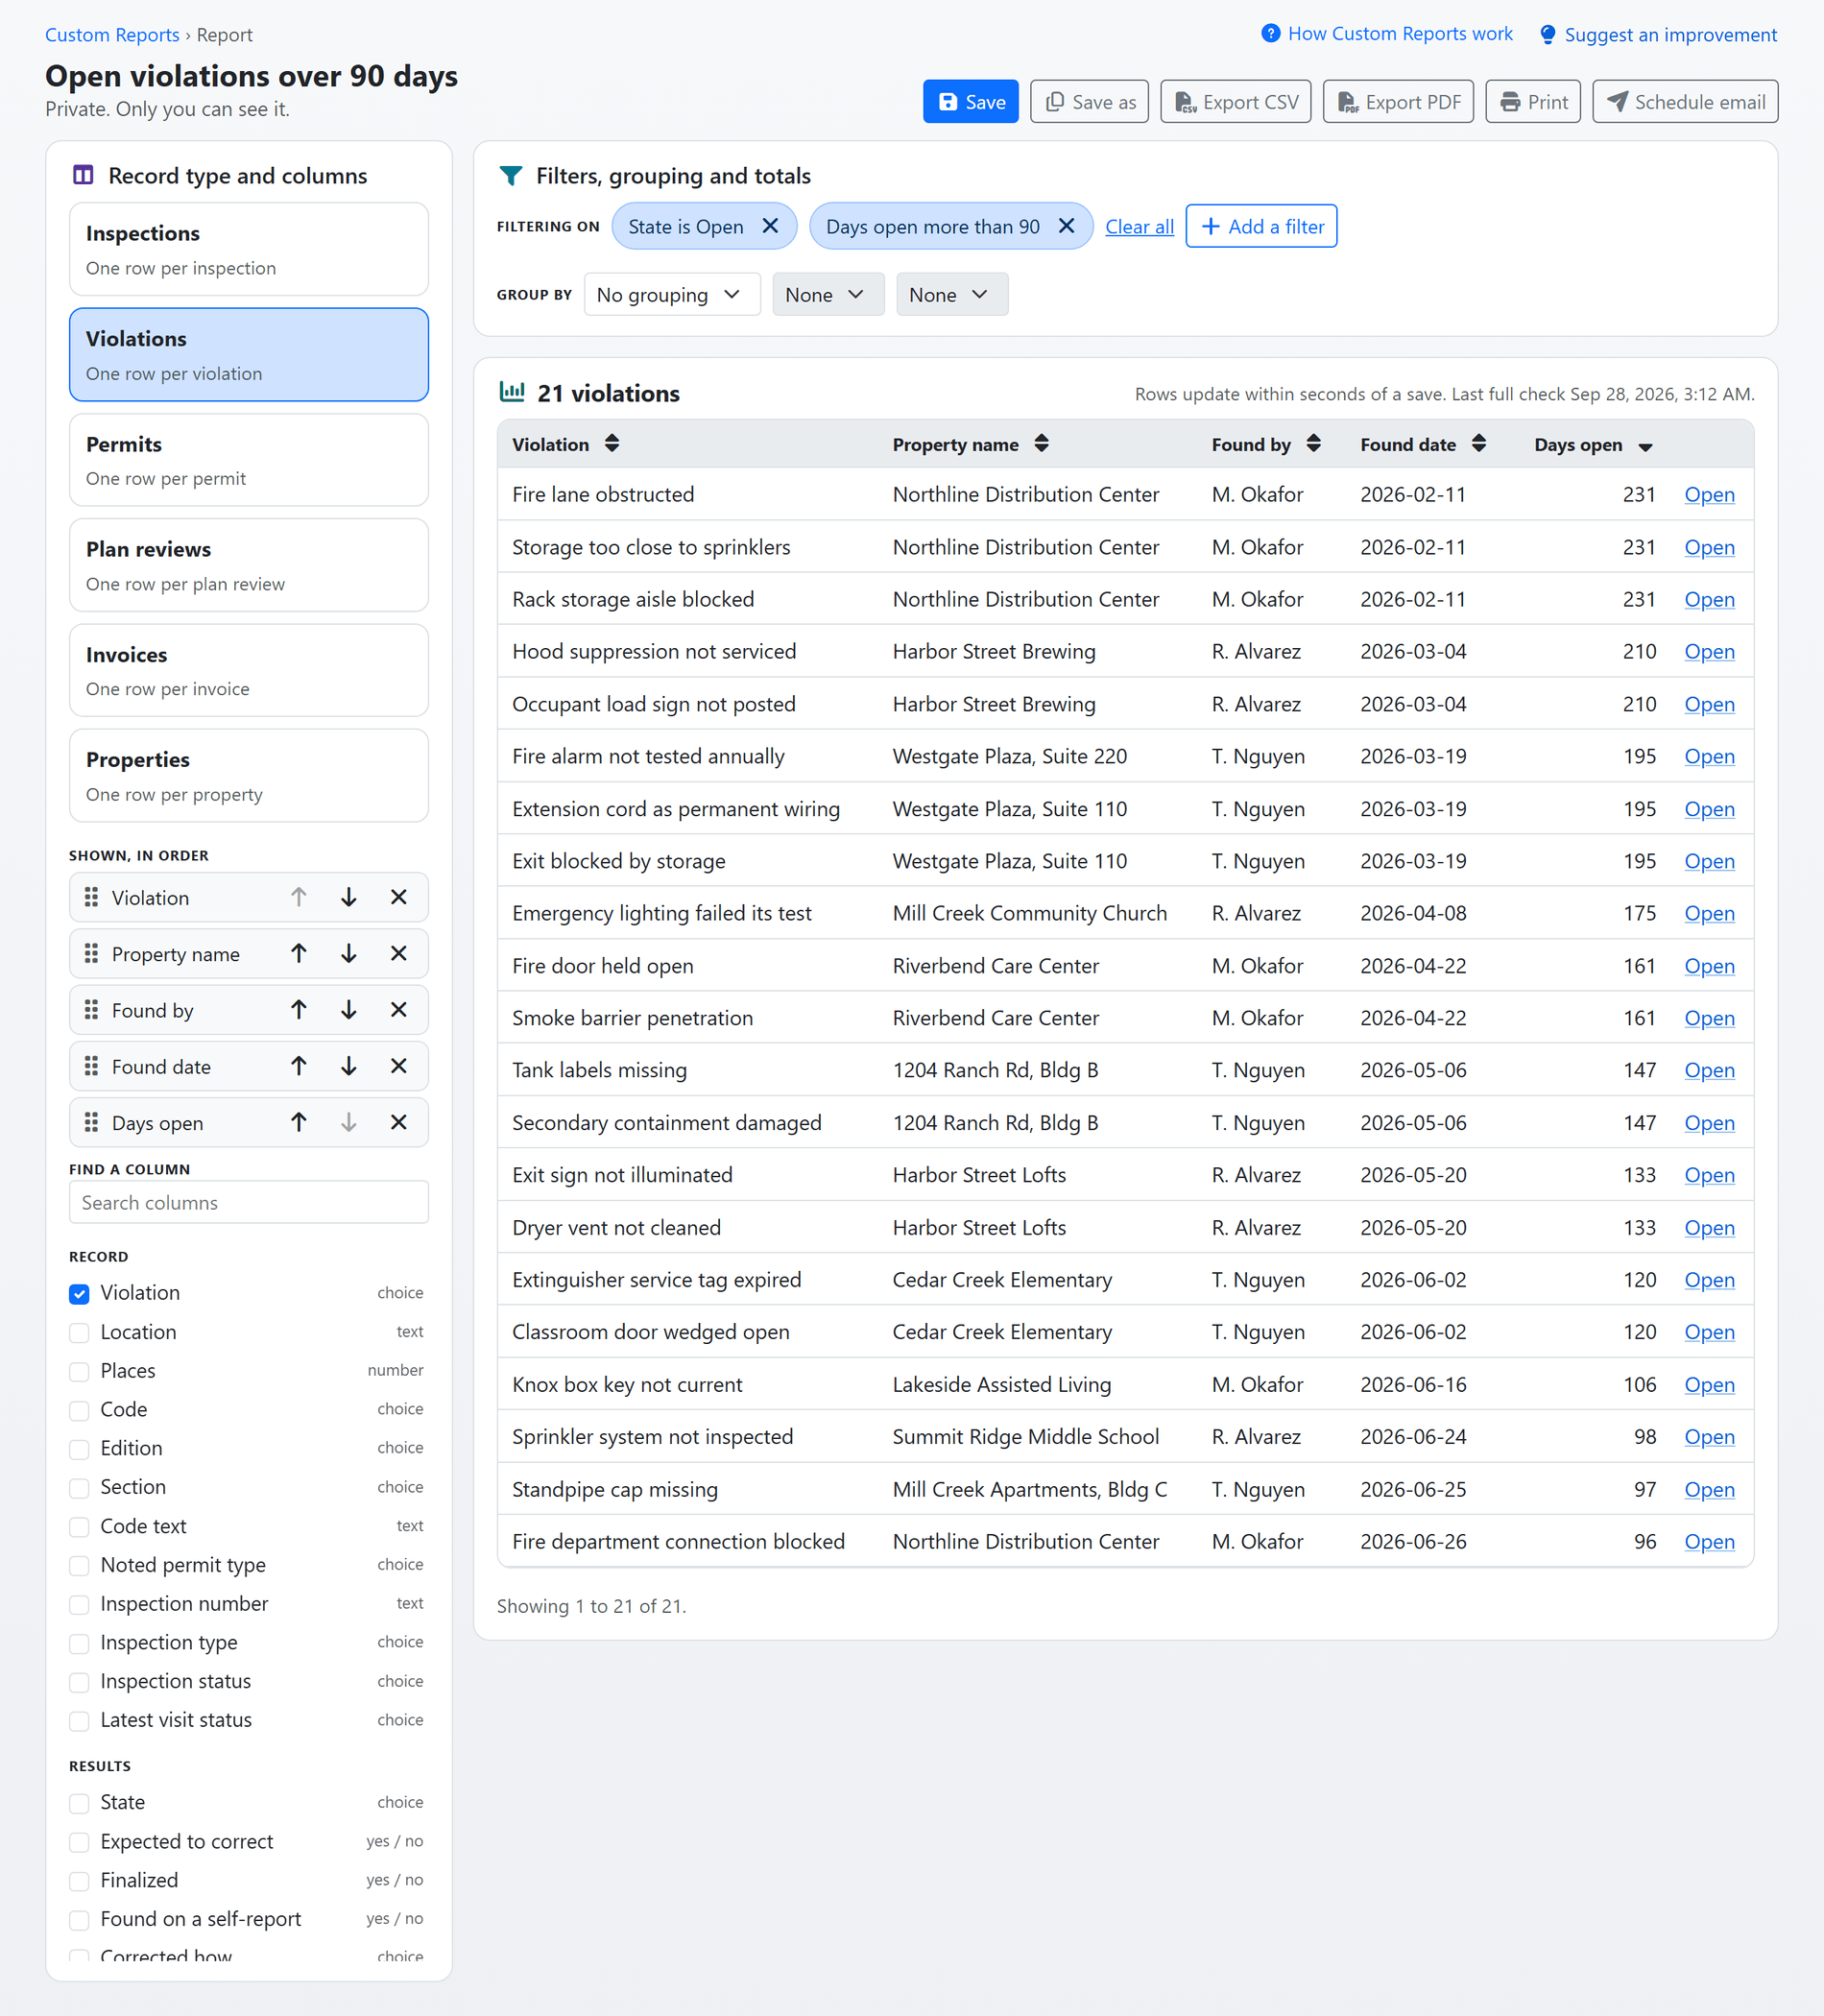
Every row opens the record behind it.
Leave a report ungrouped and it lists rows. Tick the columns you want, put them in the order you want, sort by any heading, and open the record behind any row in one click.
- Columns your way: tick a column to show it, drag or move it to change its place, and find any column by name.
- Sort by any heading: choose a column heading to sort by it, and again to turn the order around.
- Straight to the record: each row's Open link goes to the record it came from, whether an inspection, a permit, a property or the record an invoice was raised on.
- Current within seconds: rows update within seconds of a save, a full check runs every night, and the page says when that check last finished.
- Export and print: a saved report exports as a spreadsheet or a PDF, and prints as it is on the screen.
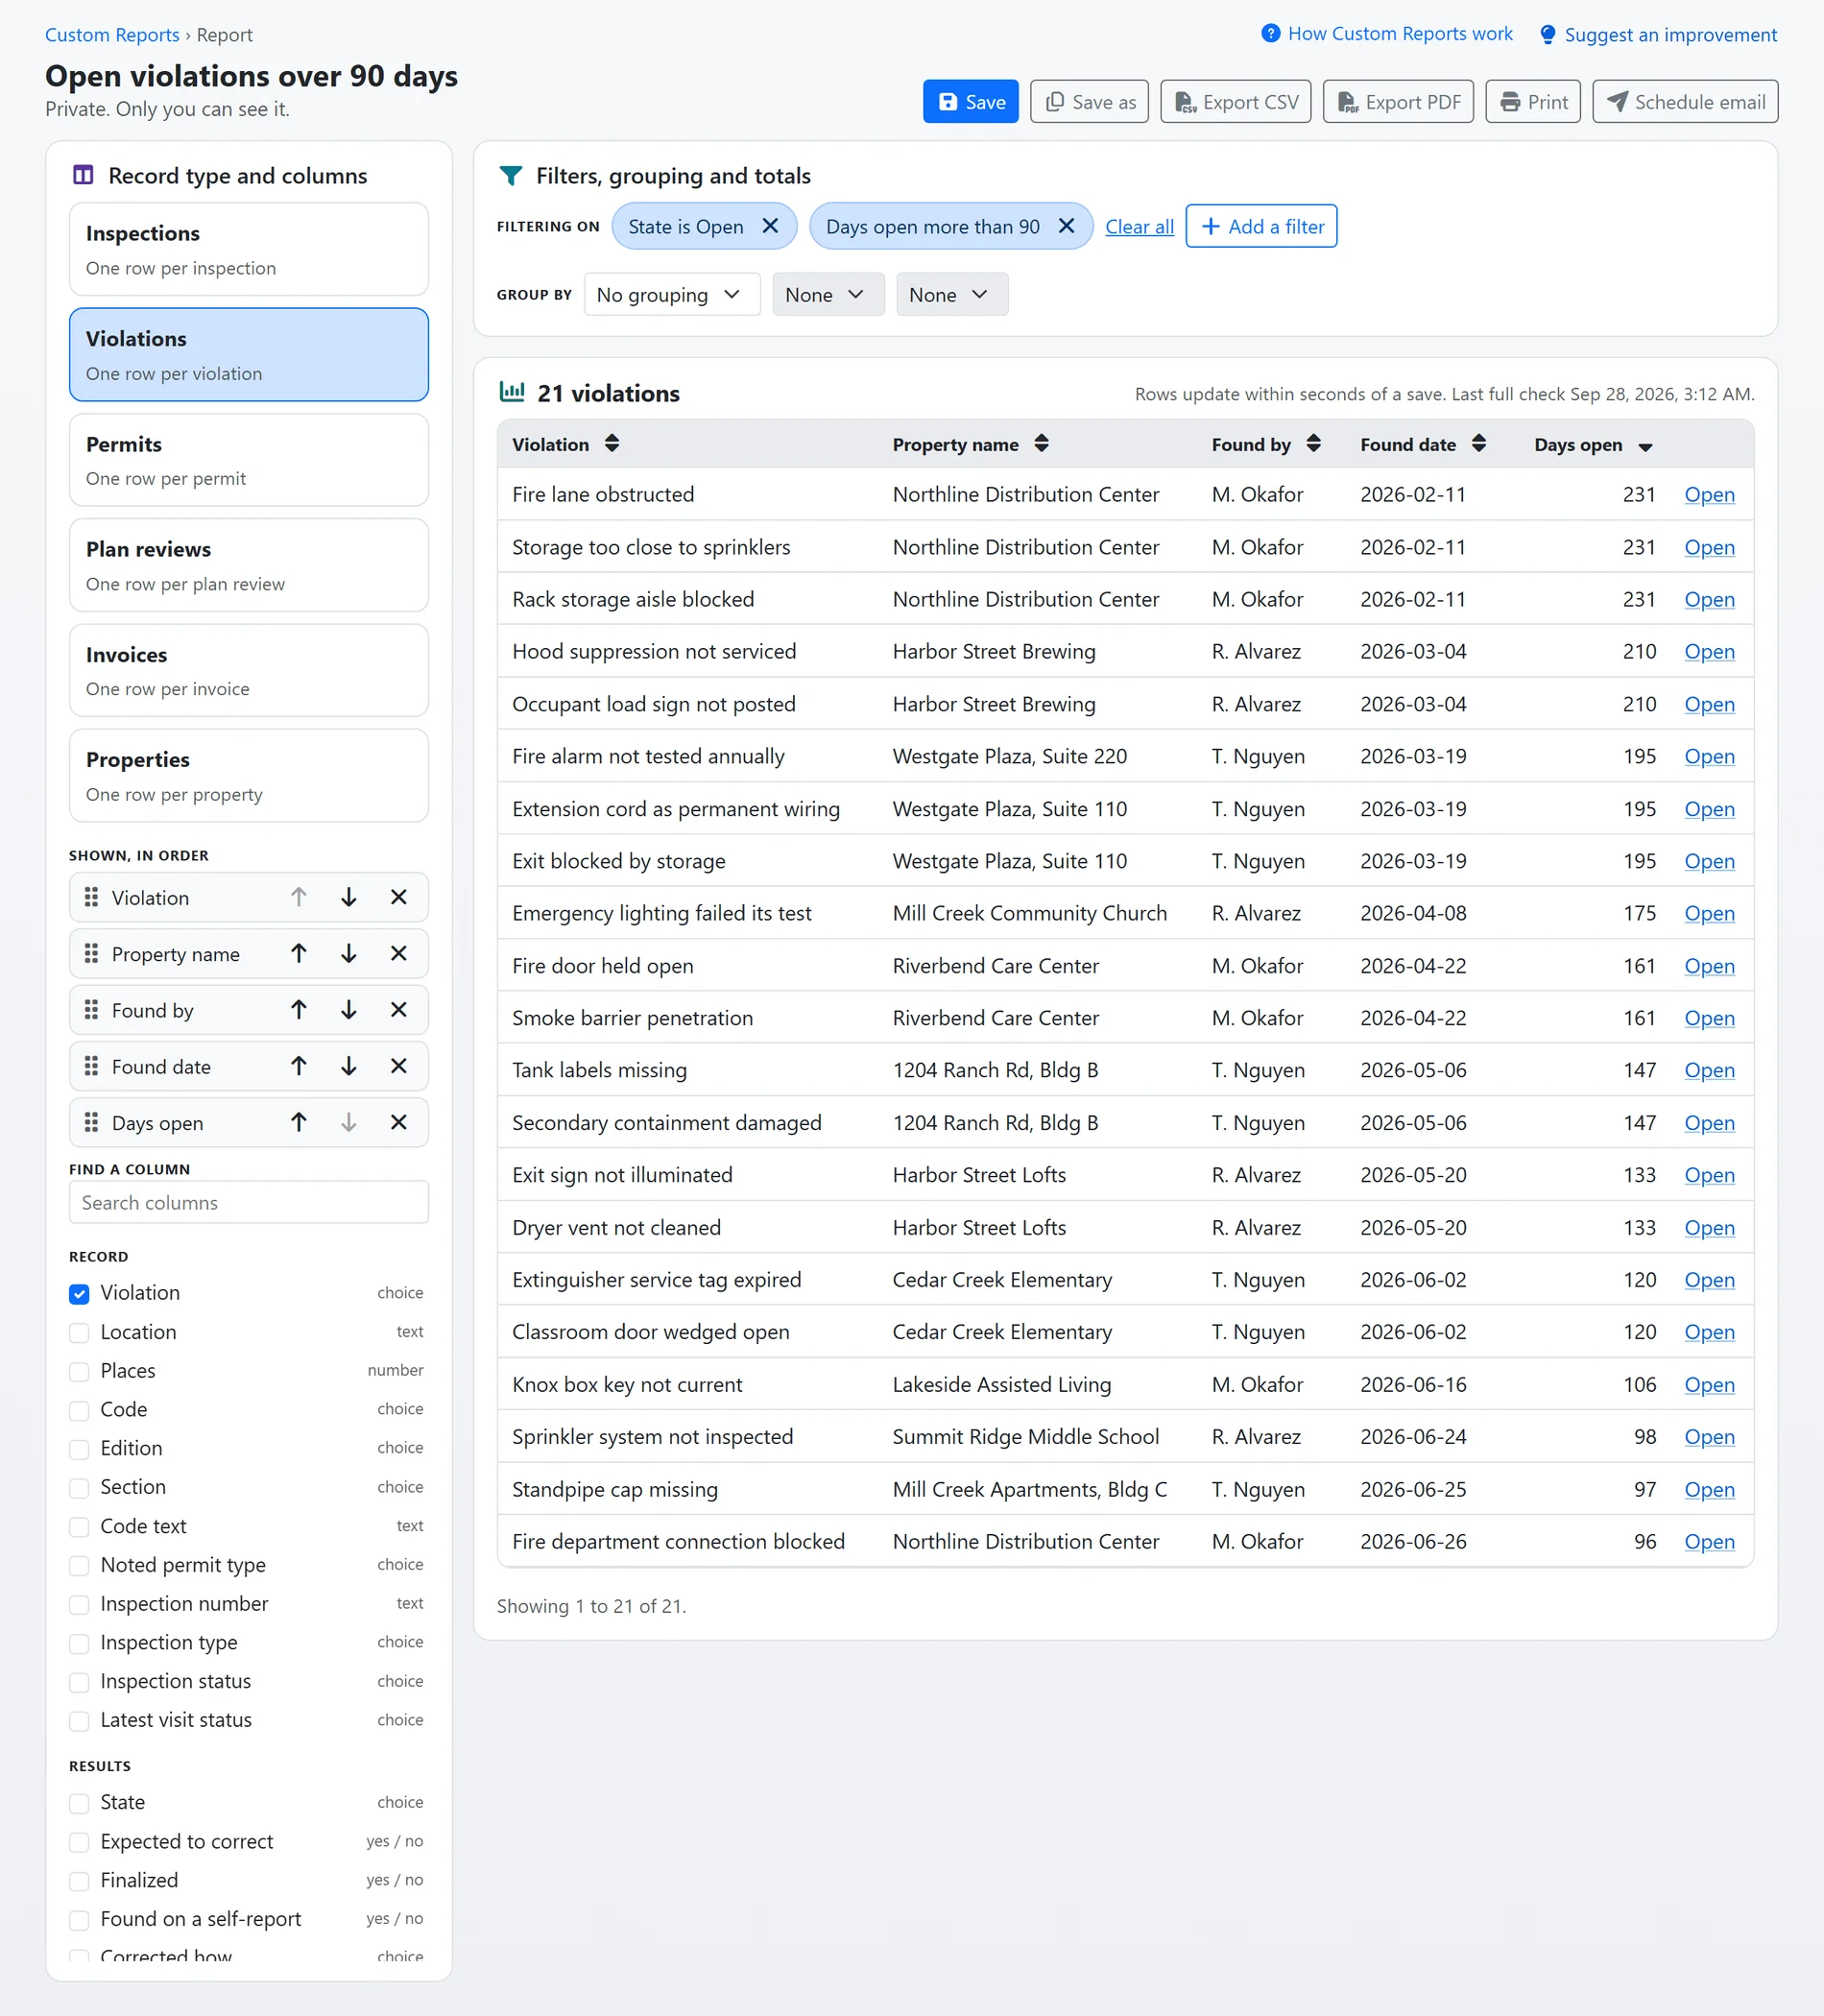
Shown with sample data.
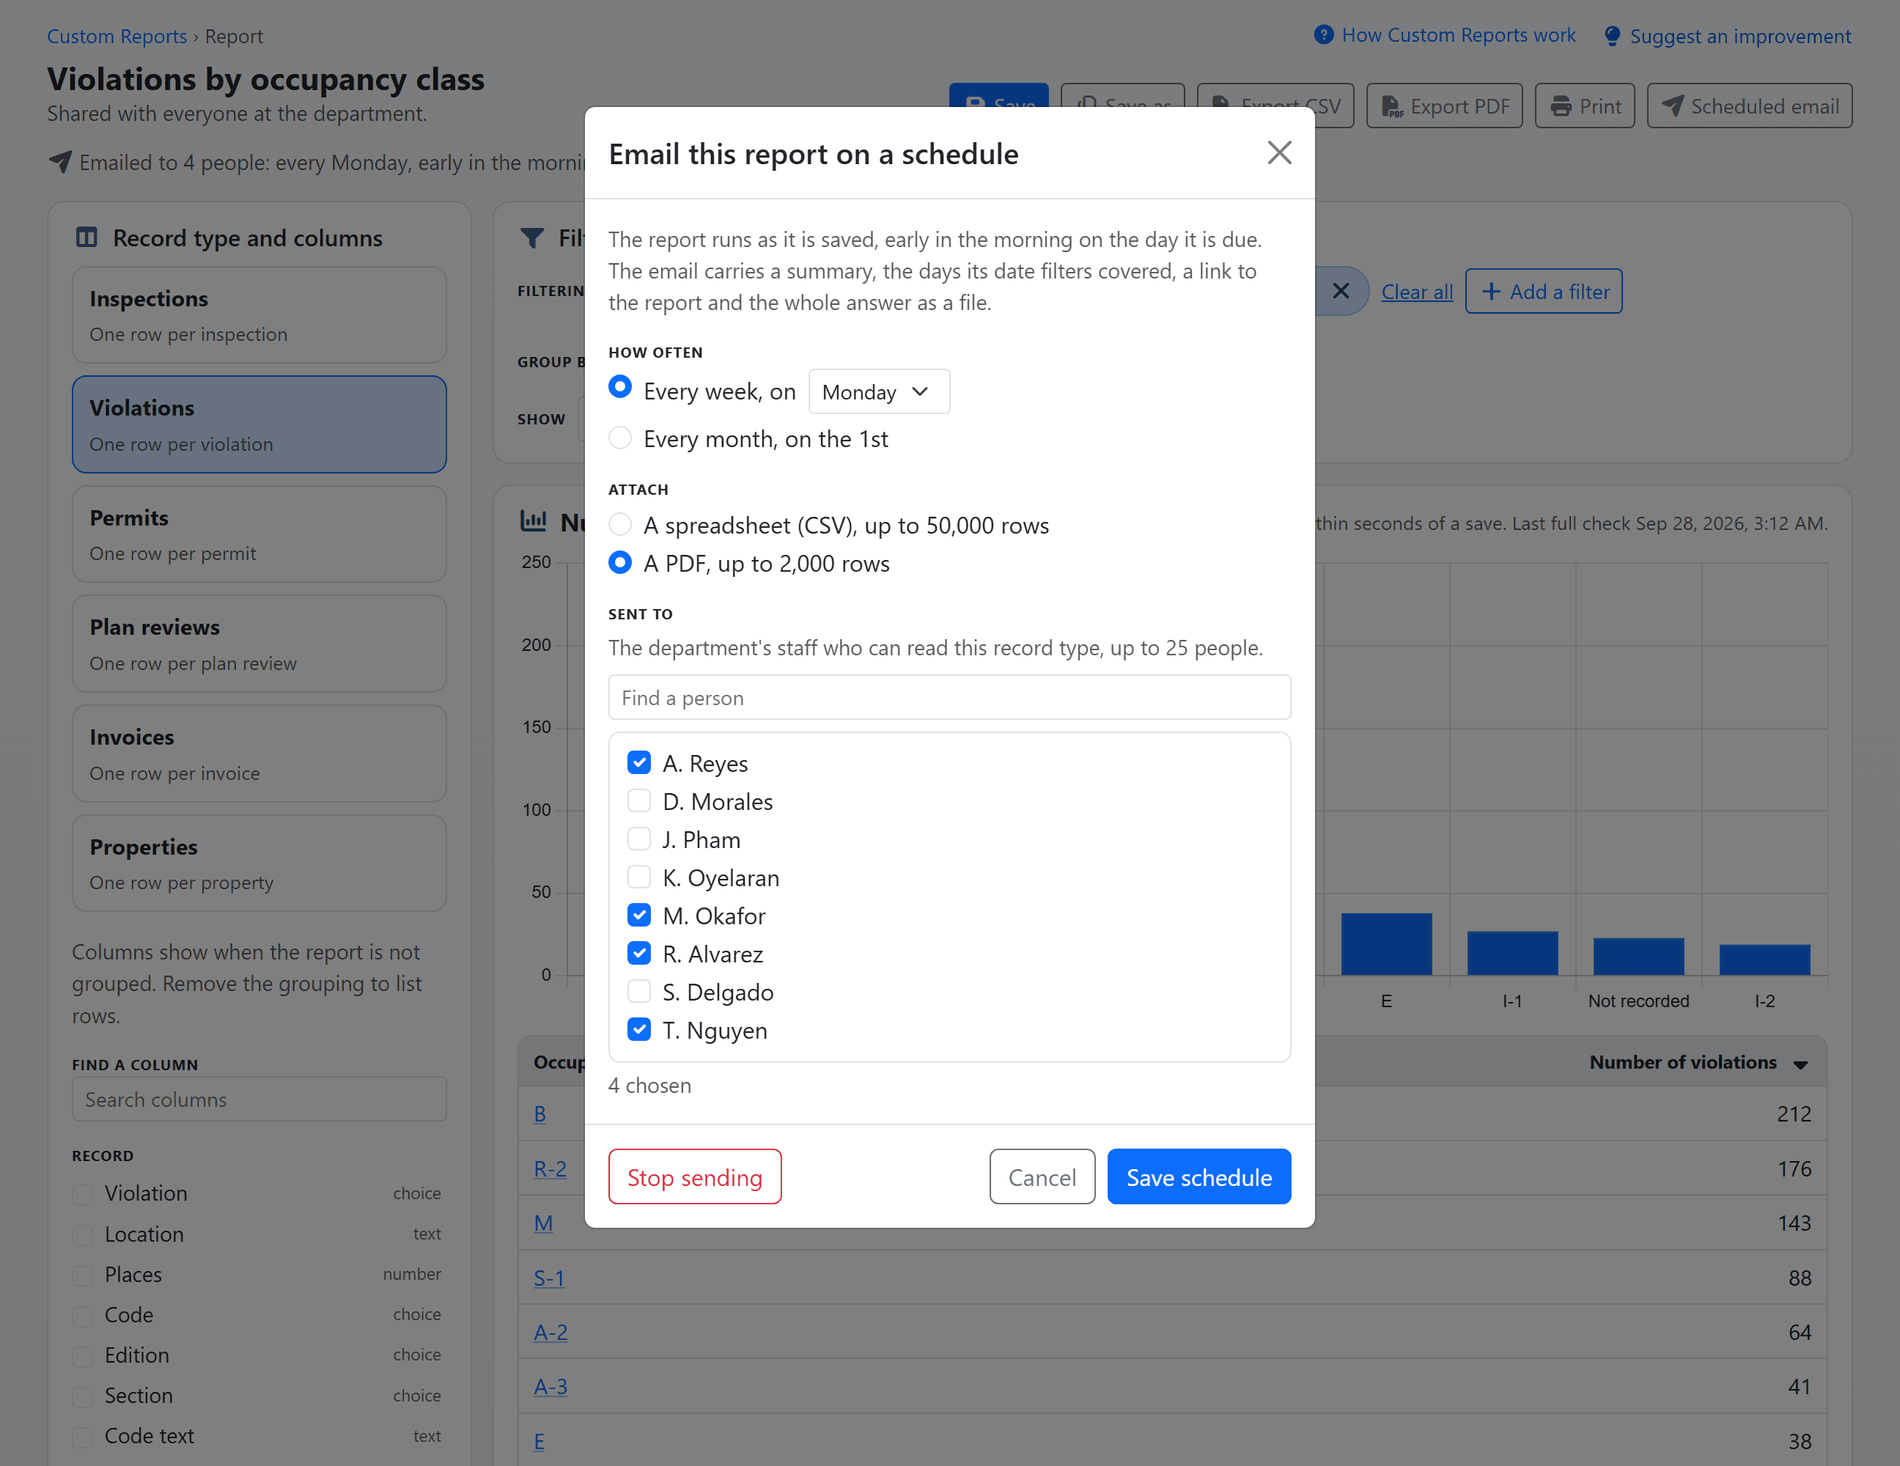
Shown with sample data. Click the image to see the whole page.
Shared with the department, in the inbox every week.
A report you save is yours alone until you share it. Shared, it belongs to the department: everyone can open and run it, and a scheduled email puts it in front of the people who need it without anyone remembering to send it.
- Private or shared: everyone saves reports of their own. Sharing one with the department, or changing a shared one, takes the Custom Report Edit permission, and Save as makes a copy anyone can change.
- Weekly or monthly: on the weekday you choose, or on the 1st of each month, early in the morning on your department's calendar.
- What the email carries: a summary with the days its date filters covered and the totals, a link to the report, and the whole answer attached as a spreadsheet or a PDF.
- Staff only: a shared report goes to staff who can read its record type, never to an outside address. A private report goes only to you.
- Nobody saved over: a report changed by someone else after you opened it is not overwritten; the page asks you to reload it first.
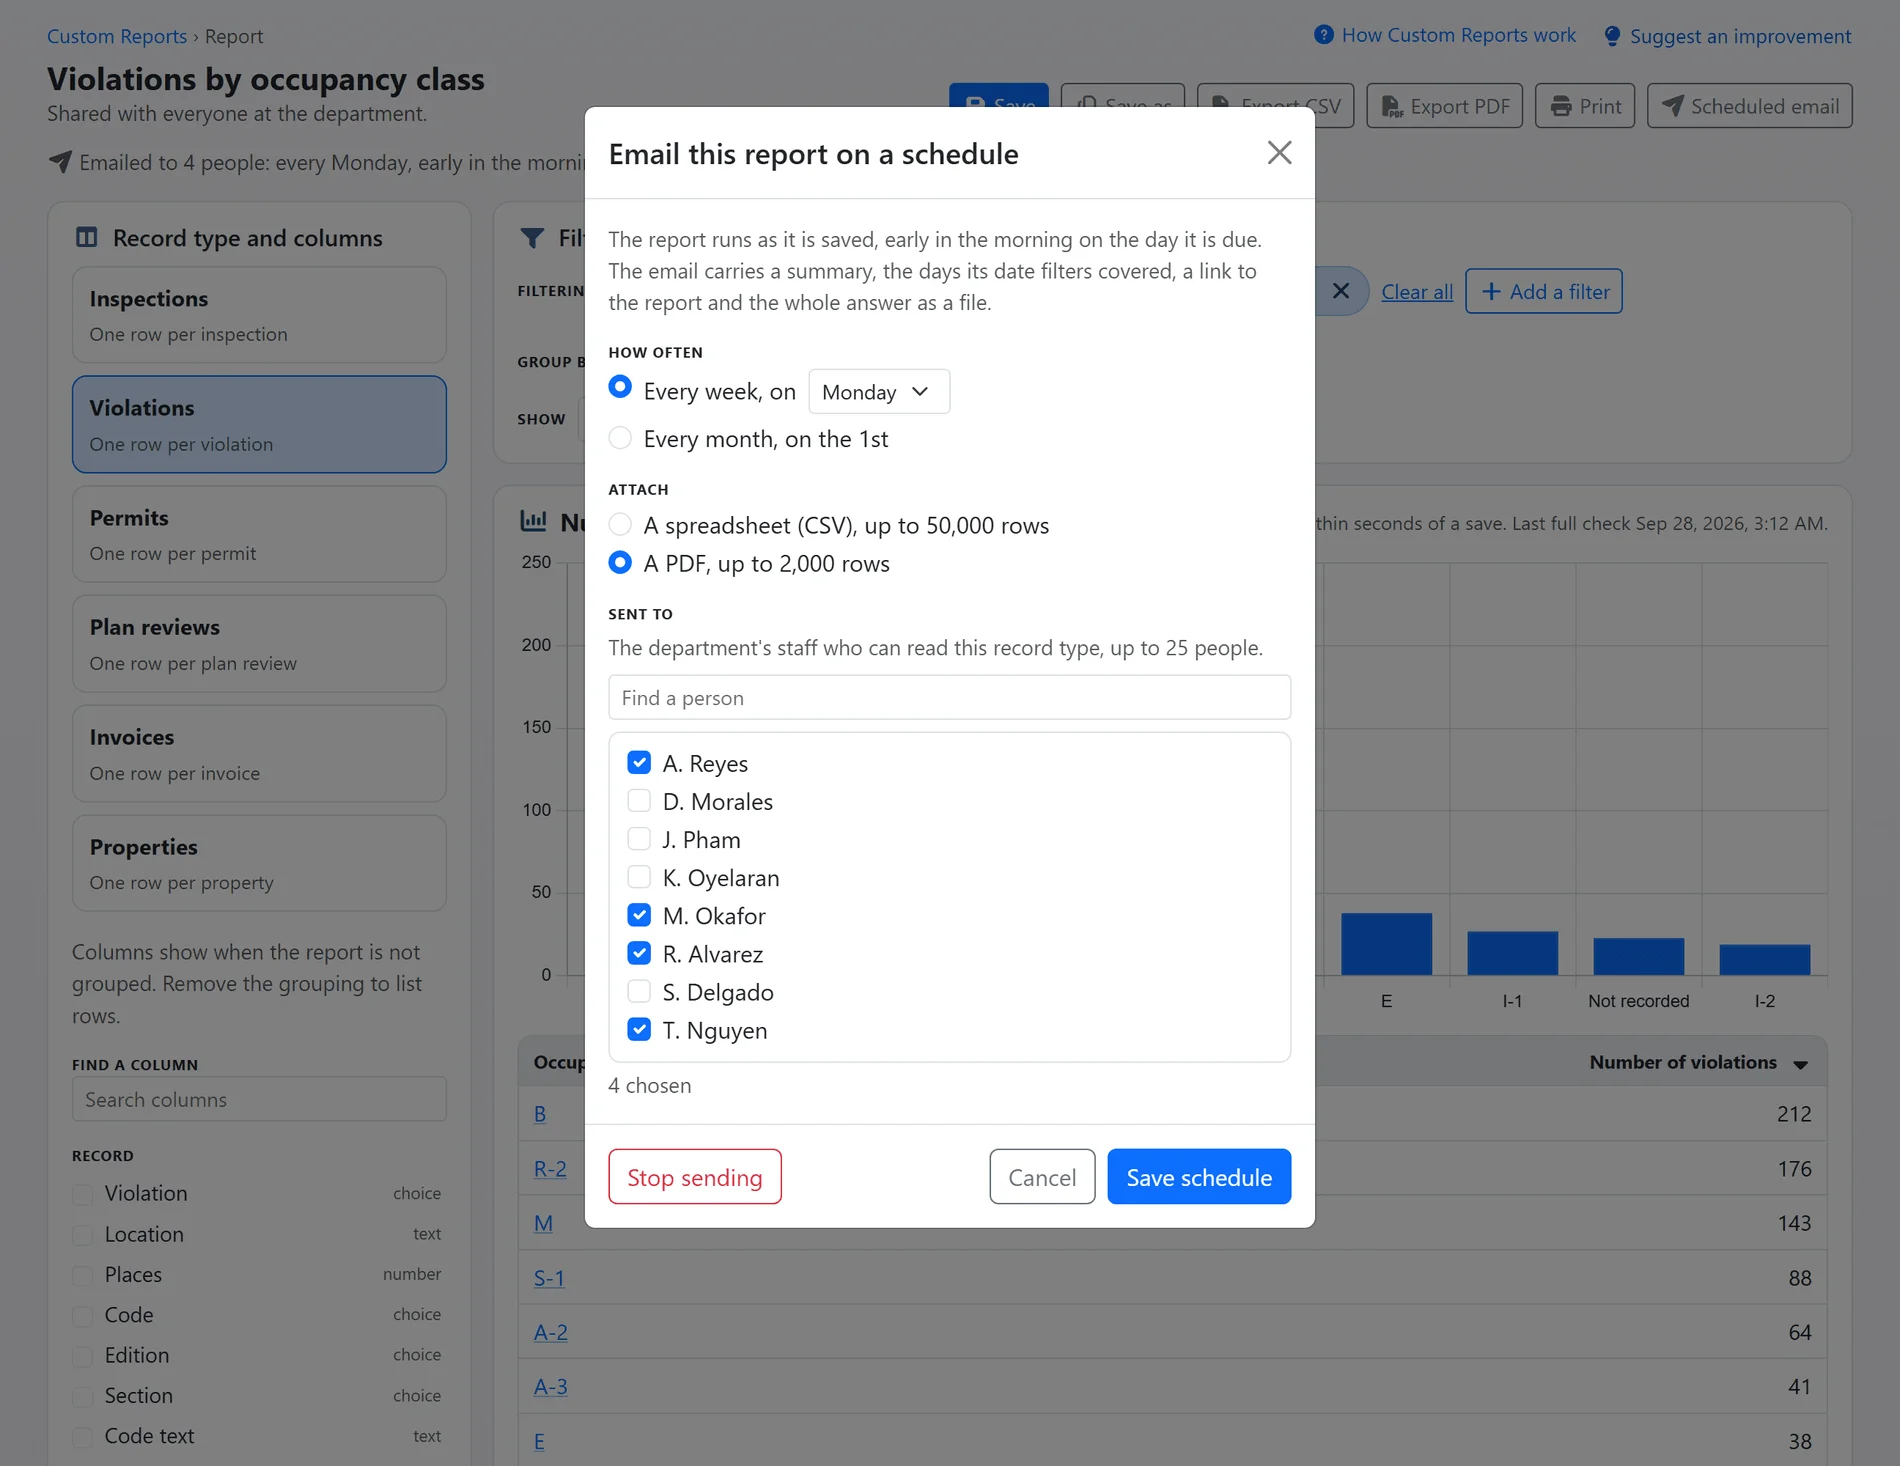
Shown with sample data.
And that is only the start
Build a report from this
The inspection and permit analytics pages carry a link that opens Custom Reports on the same record type and period, so a question a chart raises is one click from its rows.
Invoices for the people who handle money
The Invoices record type, and every report built on it, is offered only to staff who see the Financial menu. A new invoice report starts on the invoices the Financial pages count.
Contact details stay out
Reports carry property names and addresses and staff names, never a contact's phone number or email address. A property's contacts are counted, never named.
Saved reports on a phone
Saved reports open and run on a phone. Building or changing one needs a tablet or a computer.
A guide in plain words
"How Custom Reports work" is one click from the page and explains every record type, filter and limit in words taken from the system itself.
Included for every department
Custom Reports, the question box included, comes with FireInspection360. There is no add-on to buy and no extra tier.
Ask your own records a question.
A one-hour walkthrough with a fire prevention expert, or the demo site right now.